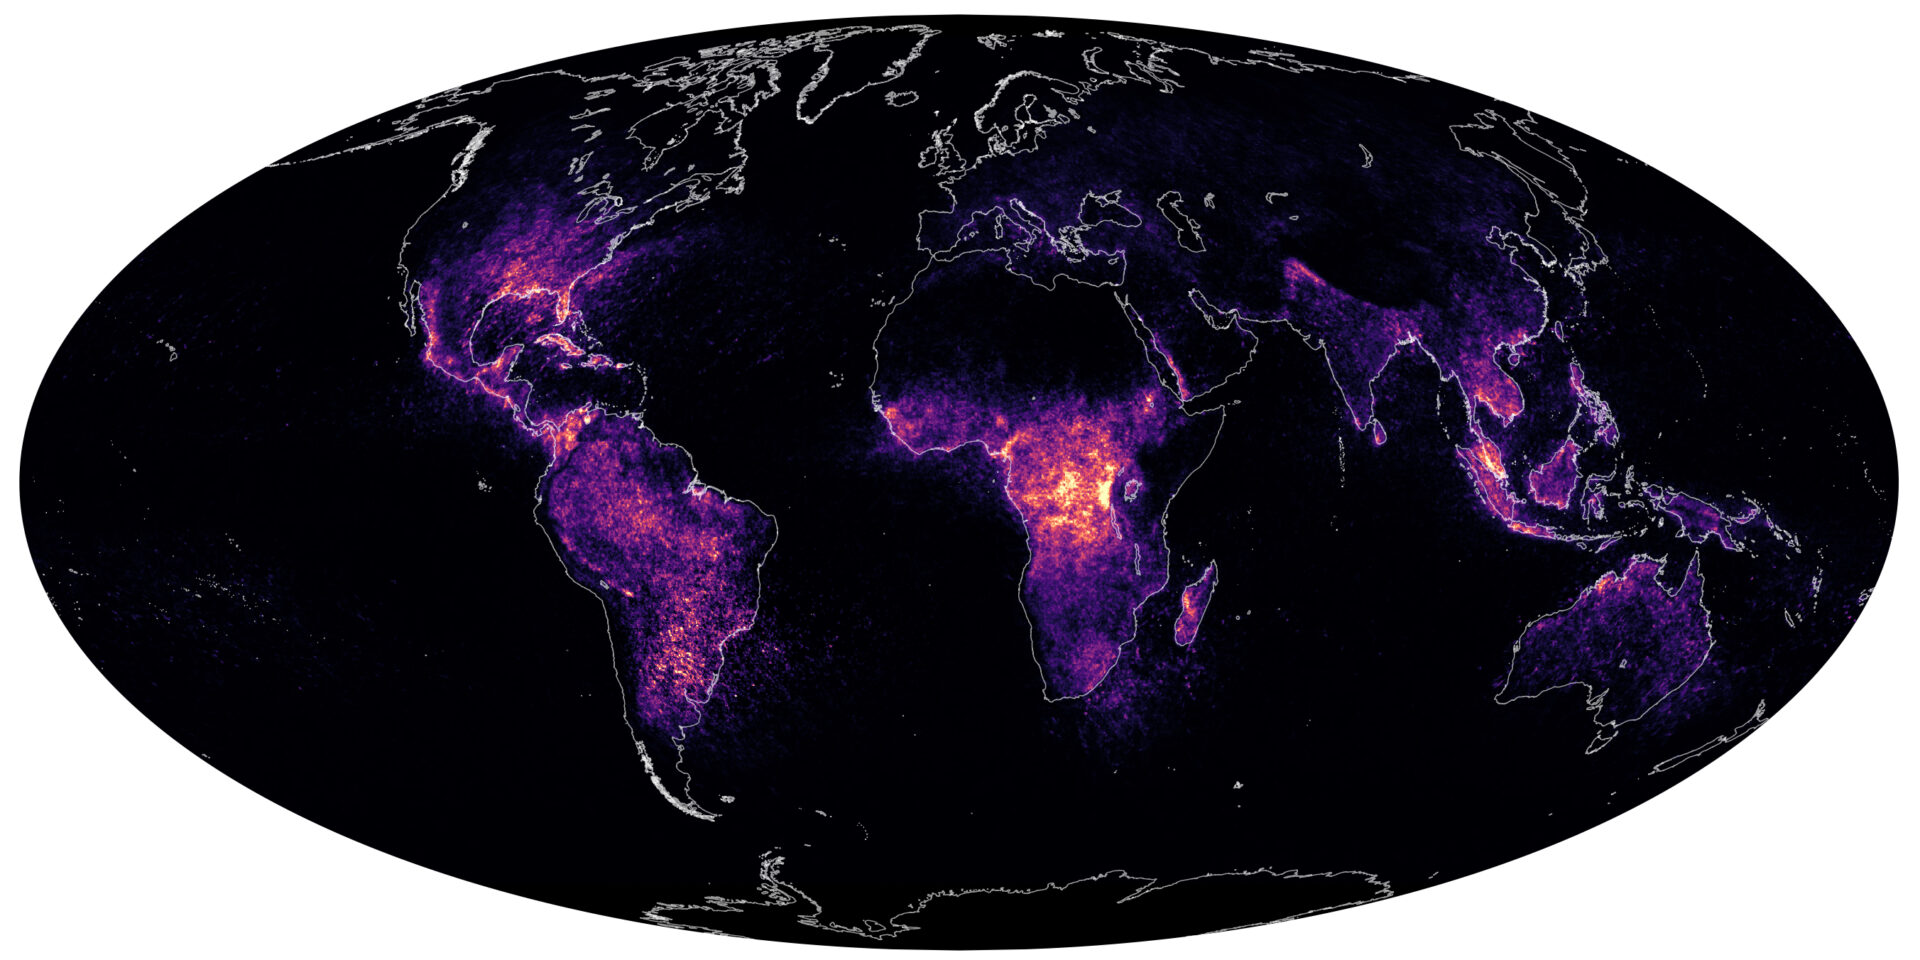
World lightning mapping

Lightning protection systems design requires a perfect understanding of lightning phenomenology and its occurrence depending on seasons and regions. Lightning maps are instrumental to assess the lightning risks for a structure or persons: obviously, risks increase with higher lightning frequency.
Lightning map are a key data. The “keraunic level” was initially referred to. It is measured by the number of days per year the lightning has been heard. This first measurement methodology lacks both precision and reliability.
With the meteo satellites era, it has been replaced by the “lightning density” (number of discharges/year/km²). “One of the first global maps of lightning activity was published in 2001 with data from the Optical Transient Detector (OTD) on the commercial OrbView-1 satellite and the Lightning Image Sensor (LIS) on NASA’s TRMM satellite. Two decades later, a second LIS mounted on the International Space Station (ISS) is adding to long-term records and making newer, better maps of global lightning activity.
The map above draws on observations from multiple sensors—the ISS LIS, the TRMM LIS, and OTD. The TRMM LIS collected data between 1997 and 2015; OTD was operational between 1995 and 2000; and ISS LIS has been flying since 2017. Scientists from Los Alamos National Laboratory and the University of Alabama-Huntsville published an updated map in March 2021. Researchers from NASA’s Marshall Space Flight Center released a similar map of lightning activity, based on three years of ISS LIS observations, in July 2020.”
This new map introduces two major changes:
- A much accurate measurement of the lightning activity in northern and southern regions
- A global view of lightning activity since it takes into account also the inter and intra clouds discharges.
The brightest areas are the most lightning prone spots worldwide : Central Africa (the Great Lakes regions), America with the Maracaibo lake that remains the most lightning struck place in the world and South East Asia (Malacca Strait)
Source : NASA Earth Observatory


