Stay Under 36 kVA: IRVE Fleet Sizing for Facility Managers

Size your fleet’s charging infrastructure with the PIRVE formula: P_PIRVE = (n × P × Ks) × Ke. Run that calculation now, and if your site needs more than five charge points, or the result approaches 36 kVA, book an on-site load study before you order any hardware. Smart charging almost always beats a subscription upgrade on cost and lead time.
TL;DR:
- Smart charging and load balancing significantly reduce the PIRVE calculation results, often allowing fleets to stay within the 36 kVA threshold and avoid costly upgrades.
- A load study becomes mandatory if the PIRVE result exceeds 36 kVA or more than five charge points are planned, especially when near the threshold.
- Correctly estimating simultaneity through realistic Ks values, supported by load-balancing systems, can lower actual demand and the total connection cost.
- Oversizing charger power or relying on vehicle count rather than duty cycle leads to unnecessary expenses and inflated PIRVE results.
- Working with professionals ensures validation of PIRVE models, proper on-site electrical assessments, and compliance with grid connection regulations.
Table of Contents
- Quick Sizing Checklist Facility Managers Can Run Today
- PIRVE Calculation Explained Step by Step
- Ks Simultaneity Table: Standard vs Smart Charging Values
- When Does Crossing 36 kVA Trigger a Mandatory Site Study?
- Selecting Charger Power and Technology by Use Case
- Smart Charging and Integrating Site Energy
- Project Workflow: Audit to Commissioning
- Costs, Funding, and ROI: What Drives the Numbers
- Case Studies: Sizing for Different Fleet Sizes
- Connecting Chargers to Building Energy Systems and On-Site Renewables
- Maintenance and Operations After Installation
- Grid Stability Impact and Mitigation Measures
- Indelec’s Field Perspective: Common Pitfalls and Pragmatic Fixes
- Get a Professional PIRVE Study for Your Fleet
- Sources
Quick Sizing Checklist Facility Managers Can Run Today
Before touching a PIRVE simulator, gather the operational facts that feed it. Guessing at inputs is the single fastest way to end up with an oversized subscription or an installation that can’t handle next year’s fleet growth.
- Classify vehicles by duty cycle. Split the fleet into overnight depot vehicles, daytime rotation vehicles, and visitor or occasional-use vehicles. Each group charges differently and needs a different power allocation.
- Estimate the percentage charging per shift. Not every van plugs in at once. A realistic estimate of simultaneous charging, not the total fleet count, drives your PIRVE result.
- Set nominal power per point by use case. Overnight depot charging rarely needs more than 7.4 kW AC. Fast turnaround fleets may justify DC.
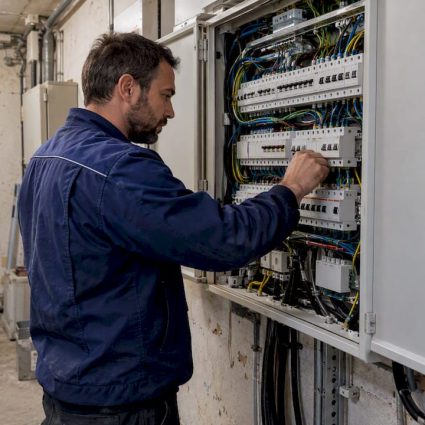
- Audit the electrical site. Note the current subscribed power, the condition of the main distribution board (TGBT), and whether spare cable ducts already exist.
- Run PIRVE scenarios and flag red lines. If the result exceeds 36 kVA or you’re deploying more than five points, that scenario needs a formal load study, not a back-of-envelope estimate.
This sequence produces exactly the inputs the PIRVE formula needs, in the order an installer or engineering firm will ask for them. A fleet sizing study built on measured usage patterns, not vehicle count, consistently produces different (and usually lower) charger counts than a naive one-charger-per-vehicle assumption.
PIRVE Calculation Explained Step by Step
The PIRVE formula comes straight from NF C 15-100 Section 722, the French electrical standard governing EV charging installations. The formula itself is:
P_PIRVE = (n × P × Ks) × Ke
Here’s what each variable actually means in a fleet context:
- n is the number of charge points you plan to install, not the number of vehicles.
- P is the nominal power per point in kW (3.7, 7.4, 11, 22, or higher for DC).
- Ks is the simultaneity coefficient, sometimes called the coincidence factor. It represents the realistic share of points charging at full power at the same moment, and it’s the single biggest lever you control.
- Ke is the evolution factor, a multiplier that reserves capacity for fleet growth.
Once you have P_PIRVE in kW, you need to convert to kVA to talk to Enedis about a subscription, since French grid subscriptions are denominated in apparent power. The standard conversion uses a power factor of cos φ = 0.9, so kVA = kW ÷ 0.9. This conversion is what determines whether you stay under the 36 kVA Tarif Bleu ceiling or cross into a different connection regime, according to the NF C 15-100 Section 722 method and PIRVE simulator.
Ke typically ranges from 1.0 (no planned growth, rare in practice) to 1.5 (aggressive electrification roadmap). A conservative but common choice is 1.2, which builds in headroom without dramatically inflating your subscription.
Worked example, small fleet: 4 points at 7.4 kW, Ks = 0.8, Ke = 1.2. P_PIRVE = (4 × 7.4 × 0.8) × 1.2 = 28.4 kW, or roughly 31.5 kVA. Comfortably under the 36 kVA threshold.
Worked example, mid-size fleet: 12 points at 7.4 kW, Ks = 0.5 (smart charging), Ke = 1.2. P_PIRVE = (12 × 7.4 × 0.5) × 1.2 = 53.3 kW, about 59 kVA. Without smart charging pulling Ks down, this same fleet at Ks = 0.8 would hit 85.2 kW, nearly 95 kVA. That single coefficient is the difference between a manageable subscription and a major grid connection project.
Ks Simultaneity Table: Standard vs Smart Charging Values
The value you assign to Ks has more influence on your final PIRVE number than almost any other input, and it’s the one you can actually reduce through technology rather than compromise. Industry simulators built on Section 722 use a tiered table based on point count, with smart charging (dynamic load balancing across points) consistently pulling the coefficient down.
| Number of charge points | Standard Ks | Smart charging Ks |
|---|---|---|
| 1 to 4 | Around 1.0 | Around 0.8 |
| 5 | About 0.8 | 0.5 |
| 10 to 15 | 0.5 | Near 0.4 |
| 20 or more | Approximately 0.5 | 0.4 |
These are the working ranges referenced by IRVE simulators and PIRVE calculation tools, and they show why smart charging isn’t a nice add-on for larger fleets, it’s often the difference between staying on Tarif Bleu and triggering a full grid upgrade.
Pro Tip:If you plan to claim a reduced Ks in a technical dossier submitted to Enedis or a design engineer, document the load-balancing system’s brand, its priority logic, and a monitoring plan showing measured simultaneity. A stated coefficient without supporting technical evidence gets challenged or rejected.
When Does Crossing 36 kVA Trigger a Mandatory Site Study?
Staying at or under 36 kVA keeps you on Tarif Bleu, the standard low-voltage connection regime. Cross that line, and you move into a different administrative and technical process: HTA connection studies, longer Enedis lead times, and materially higher connection costs. Staying under 36 kVA where feasible is operationally the smarter path whenever your usage pattern allows it.
Two practical trigger rules, used consistently across IRVE simulation tools, tell you when to stop estimating and start commissioning a formal study:
- More than five charge points planned for the site, regardless of the PIRVE result.
- A PIRVE calculation that lands close to, at, or above 36 kVA, even with conservative Ks assumptions.
A proper on-site load and profile study typically delivers three things: a recommended P_PIRVE validated against real electrical measurements (not just the formula), a specification for the protections and switchgear needed at the TGBT, and a realistic timeline for any Enedis connection work. That timeline matters. HTA connection studies and works can add months to a project, so if your scenario planning shows you’re near the threshold, book the study before you commit to a charger order, not after.
Selecting Charger Power and Technology by Use Case
Matching charger power to actual vehicle behavior, not to what looks impressive on a spec sheet, is where most PIRVE inputs go wrong. Overspecifying power per point inflates every downstream number in the formula.
- 3.7 kW fits vehicles parked for very long periods, think weekend fleet vehicles or long-dwell visitor bays where an overnight trickle charge is more than enough.
- 7.4 to 22 kW AC covers most depot and employee parking scenarios, where vehicles sit for 6 to 10 hours overnight and a full charge doesn’t need to happen fast.
- 50 kW and above, DC, is justified only when the fleet has genuinely high duty cycles: same-day multiple rotations, delivery fleets needing a rapid top-up between routes, or shared vehicles with no fixed overnight home base.
DC fast charging costs considerably more to install and adds electrical complexity, so it earns its place only where operational turnaround genuinely demands it, according to guidance on charger selection and IRVE obligations for businesses. On the metering side, confirm connector standards (Type 2 for AC, CCS Combo for DC in most European fleets) and decide upfront whether you need per-vehicle or per-employee billing, since that shapes which charge point management system you specify.
Smart Charging and Integrating Site Energy
Load balancing is the technical mechanism behind the lower Ks values in the table above, and it works two ways: local balancing at the site level, or a centralized supervision system (SGC) managing priority across multiple sites. Either way, the logic is the same: urgent operational vehicles get power first, and the system throttles or delays lower-priority sessions to stay under a target power ceiling.
- Local balancing suits single-site fleets; a central SGC makes sense once you’re managing charging across multiple depots.
- Lowering measured Ks through active pilotage is often what keeps a growing fleet from ever needing a subscription upgrade.
- Pairing chargers with on-site solar and battery storage adds peak shaving and lets you shift charging into cheaper tariff windows.
- Track simultaneity, energy consumed per vehicle per day, and average session duration as ongoing operational KPIs, not just installation-day assumptions.
Pro Tip:Pilot smart charging on your first phase of chargers and monitor real-world Ks for 60 to 90 days before finalizing the sizing for a full rollout. Assumed coefficients and measured ones are rarely the same number.
Project Workflow: Audit to Commissioning
A fleet IRVE project moves through five stages, and skipping the early ones is what causes expensive rework later.
- Audit. Produce a fleet usage matrix, a parking heatmap showing where vehicles actually sit, and an electrical site report covering the TGBT, existing ducts, and metering.
- Sizing. Run PIRVE scenarios, document your Ks and Ke assumptions explicitly, and land on a recommended subscription level.
- Design. Size protections, plan cable routing and civil works, confirm accessibility compliance, and finalize the metering architecture.
- Installation. Execute civil and electrical works against the design package, with inspections at each milestone.
- Commissioning and operations. Test every point, hand over the SGC configuration, train facility staff, and put a maintenance contract in place with defined performance KPIs.
Documenting assumptions at the sizing stage, not just the final numbers, is what lets a facilities team defend the design later when the fleet grows or a new stakeholder asks why a particular subscription was chosen.
Costs, Funding, and ROI: What Drives the Numbers
Civil works, cabling runs, protection equipment, the chargers themselves, the load management system, and any grid connection fees are the main line items. If your PIRVE result forces a subscription increase, factor in the TURPE network usage tariff implications too, since a higher subscribed power tier changes your ongoing grid fees, not just the connection cost.
- ADVENIR and regional grant programs have historically supported IRVE deployment for businesses, but eligibility rules and funding levels shift, so verify current terms before budgeting them into a project.
- ROI comes from three angles: energy cost savings versus fuel, lower fleet maintenance from electric drivetrains, and compliance value tied to CSR reporting.
- Smart charging typically pays back faster than a network upgrade because it avoids both the connection fee and the higher ongoing subscription tier. A capacity upgrade only makes sense once load balancing genuinely can’t accommodate your operational peak.
Case Studies: Sizing for Different Fleet Sizes
A small facilities fleet, say five utility vans at a single depot, rarely needs more than four to six charge points at 7.4 kW AC. Run the numbers with a standard Ks of 0.8 and no smart charging, and you land around 24 to 28 kW, comfortably inside Tarif Bleu with room to spare for Ke growth assumptions.
A mid-size regional fleet, 15 to 20 vehicles across two shifts, looks different. Here, smart charging isn’t optional; it’s what keeps the project affordable. At 12 points and standard Ks, the PIRVE result pushes close to or past 36 kVA. Add load balancing to drop Ks into the 0.4 to 0.5 range, per the Ks values published for IRVE simulations, and the same fleet stays on the standard connection regime.
A large logistics fleet with 30-plus vehicles and tight turnaround windows is where DC fast charging enters the picture. Even a handful of 50 kW DC points can push total demand well past 36 kVA, and at that scale a formal on-site load study isn’t a recommendation, it’s unavoidable. These projects typically involve staged rollout: AC charging for the overnight bulk of the fleet, with DC reserved for the small subset of vehicles that genuinely need a fast midday top-up. Sizing each subset separately, rather than averaging across the whole fleet, produces a far more accurate PIRVE result than a single blended calculation.
Connecting Chargers to Building Energy Systems and On-Site Renewables
Charging infrastructure rarely sits in isolation from the rest of a facility’s electrical system. If your building already runs a building energy management system (BEMS), integrating the charge point supervision layer with it lets you see charging load alongside HVAC, lighting, and process loads on one dashboard, rather than managing EV charging as a disconnected system.
That integration pays off most clearly when a site has on-site solar generation. Charging schedules can be shifted to align with solar production peaks, cutting grid draw during the middle of the day. Pairing chargers with battery storage adds another layer: stored solar energy can cover evening charging sessions, or batteries can discharge during peak tariff periods to avoid drawing high-cost grid power at exactly the moment charging demand spikes.

The practical requirement is protocol compatibility. Confirm your charge point management system and your BEMS or building automation platform can exchange data, whether through OCPP on the charging side or a standard building protocol like BACnet or Modbus on the facilities side, before finalizing hardware selection. Retrofitting integration after installation is possible but adds cost and often means replacing controllers that seemed adequate at the time of purchase. Facility managers planning a phased rollout should specify integration capability in year one, even if the BEMS connection itself gets activated later.
Maintenance and Operations After Installation
Charging infrastructure is not a set-and-forget system. Connectors wear from repeated plugging cycles, load balancing software needs firmware updates, and protection devices at the TGBT require periodic testing just like any other electrical safety equipment on site.
A maintenance contract should cover preventive inspection of connectors and cabling, software updates for the supervision system, and periodic verification that the actual measured Ks still matches the assumptions used at design time. Fleets grow, usage patterns shift, and a coefficient that was accurate at commissioning can drift within a year or two, quietly pushing real demand closer to the subscription ceiling without anyone noticing until a fault trips.
Operationally, track charger uptime and session failure rates as basic KPIs. A charge point that fails intermittently doesn’t just inconvenience a driver, it can cascade into schedule disruptions if a vehicle isn’t ready for its next route. Facility teams that treat charging infrastructure with the same maintenance discipline as HVAC or backup power systems avoid the scenario where a fleet manager discovers a dead charger the same morning a delivery route depends on it.
Grid Stability Impact and Mitigation Measures
An undersized subscription paired with an oversized fleet is how sites end up tripping breakers during evening charging peaks, but the reverse problem, an oversubscribed connection that overestimates simultaneous demand, has its own cost: businesses pay for capacity they rarely use. Both outcomes trace back to the same root cause, PIRVE assumptions that don’t reflect real usage.
At the local grid level, a cluster of fleet depots charging simultaneously in a single distribution zone can create demand spikes that stress transformers and feeders not originally designed for that load profile, which is part of why Enedis flags the 36 kVA threshold as a review point rather than a hard ceiling. Smart charging is the primary mitigation tool available to an individual site: by actively managing when and how fast each vehicle charges, load balancing spreads demand instead of letting every plugged-in vehicle draw maximum power at once.
Beyond load balancing, pairing charging infrastructure with on-site storage or solar generation reduces a site’s net draw from the grid during peak windows, which is a mitigation measure that benefits both the individual business’s subscription costs and the broader grid’s stability. For fleets planning significant expansion, aligning the project with a regional SDIRVE master plan helps ensure private charging growth doesn’t compound with public charging rollout in ways that overload the same local grid segment. SDIRVE guidance specifically advises against applying flat, one-size-fits-all charger ratios across sites, precisely because local grid capacity varies.

Indelec’s Field Perspective: Common Pitfalls and Pragmatic Fixes
The most frequent mistake facility teams make is sizing from vehicle count instead of duty cycle. Ten vans doesn’t mean ten simultaneous full-power charges. It means measuring how many actually plug in at once.
The second is underestimating Ke to save on upfront subscription cost, then facing a TGBT rework two years later when the fleet grows faster than planned. A documented, conservative Ke avoids that. Pilot smart charging first, measure real Ks over a full quarter, then scale the rollout with numbers you trust instead of numbers you assumed.
— INDELEC
Get a Professional PIRVE Study for Your Fleet
Running the PIRVE formula yourself gets you a working estimate. Getting it validated against your site’s actual electrical capacity, and installed with Enedis compliance handled correctly the first time, is a different job entirely. Indelec’s mobility team runs the full sequence: electrification audits, PIRVE modelling with documented Ks and Ke assumptions, on-site load and profile studies when you’re near the 36 kVA threshold, and installation supervision through commissioning.

Working with a team that handles the Enedis interface daily means fewer surprises on connection timelines and a technical dossier that holds up if your coefficients get questioned. Indelec also carries maintenance contracts forward once the install is live, so the same team that sized your system is the one keeping it running. If your fleet is approaching five charge points or your PIRVE estimate is creeping toward 36 kVA, request a fleet charging audit through Indelec Mobility before you commit to hardware.
Sources
Start with the PIRVE calculation method and simulator built on NF C 15-100 Section 722, plus IRVE sizing tools for scenario testing. For territorial alignment, check the SDIRVE data schema and the Legifrance regulatory reference governing IRVE obligations.