What Is Lightning Mapping? A Guide for Infrastructure Pros

TL;DR:
- Lightning mapping involves detecting and geolocating lightning activity to assess storm hazards in real time. Combining satellite-based optical data from NOAA’s GLM with ground-based RF detection from the NLDN provides a comprehensive understanding of lightning risks for infrastructure protection. This integrated approach enhances hazard detection, risk assessment, and the design of effective lightning protection systems.
Lightning mapping is defined as the detection and geolocation of lightning activity, including in-cloud, cloud-to-cloud, and cloud-to-ground flashes, onto geographic coordinates and a time history so that professionals can assess storm behavior and hazards in real time. For infrastructure engineers and environmental scientists, this capability is not a weather curiosity. It is a foundational tool for electrical risk management, grid protection, and wildfire ignition forecasting. Two systems define the field: NOAA’s Geostationary Lightning Mapper (GLM), operating from satellite orbit, and the National Lightning Detection Network (NLDN), a ground-based sensor array covering the continental United States. Understanding what lightning mapping delivers, and where each system falls short, directly shapes how you design protection protocols and respond to severe weather events.
What technologies and sensor networks power lightning mapping systems?
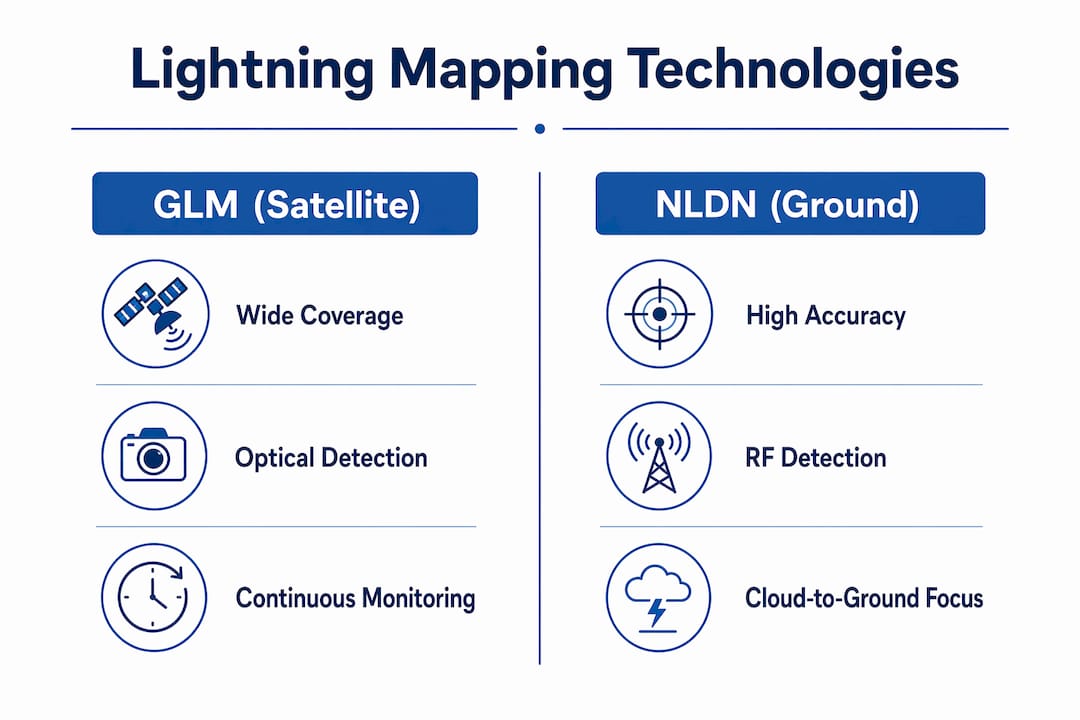
Lightning mapping technology operates through two distinct detection physics: optical sensing from geostationary satellites and radio-frequency (RF) detection from ground-based networks. Each approach captures different aspects of lightning activity, and neither alone provides a complete picture.
NOAA’s Geostationary Lightning Mapper (GLM), aboard the GOES-R series satellites, detects lightning optically using a near-infrared narrow band centered at 777.4 nm, with a sensor running at 500 frames per second on a 1,372 by 1,300 pixel CCD focal plane. That frame rate is fast enough to capture the brief optical pulse of a lightning discharge, which lasts only a few milliseconds. The GLM covers the full Western Hemisphere continuously from geostationary orbit, making it the only system capable of monitoring lightning over oceans and remote regions where ground sensors do not exist.
The NLDN ground network uses more than 100 remote sensors distributed across the U.S. to detect the electromagnetic signals that lightning radiates at radio frequencies. Each sensor records the time, polarity, signal strength, and number of strokes for every detected flash. Because RF signals travel at the speed of light and arrive at multiple sensors with measurable time differences, the network calculates strike location through time-of-arrival triangulation. This method delivers high spatial accuracy for cloud-to-ground strokes, typically within a few hundred meters.
| Feature | GLM (Satellite, Optical) | NLDN (Ground-based, RF) |
|---|---|---|
| Coverage area | Full Western Hemisphere | Continental U.S. |
| Lightning types detected | All types (in-cloud and CG) | Primarily cloud-to-ground |
| Update frequency | 20 to 60 seconds | Near-continuous |
| Spatial resolution | ~8 km at nadir, varies by angle | Sub-kilometer for CG strokes |
| Best use case | Wide-area storm tracking | Precise strike attribution |
Pro Tip:When designing lightning protection for a facility near the coast or in a remote region, GLM data fills the geographic gaps that ground networks cannot cover. Use it to establish baseline flash density for your site before selecting protection system specifications.
What types of lightning data do mapping systems capture?
Lightning mapping systems organize raw detections into a hierarchy of events. A single lightning discharge produces multiple data objects at different scales.
The GLM data hierarchy works as follows:
- Events are individual pixel detections on the sensor, representing the smallest unit of optical energy captured.
- Groups are clusters of events occurring within a short time window and spatial proximity, corresponding to a single lightning channel segment.
- Flashes are the highest-level object, grouping all groups associated with one complete lightning discharge from initiation to termination.
Each flash record carries attributes including time of occurrence, geographic centroid, polarity (positive or negative charge transfer for cloud-to-ground strokes), stroke count, and optical energy. The NLDN records similar attributes for cloud-to-ground strokes with higher precision on polarity and peak current, which matters for assessing the damage potential of a specific strike on electrical infrastructure.
Data processing is not trivial. The CIERRA reprocessing dataset recombines split flashes and filters sensor noise from raw GLM data, improving flash-count accuracy for quantitative modeling. Without this correction, artificial flash breaks in the satellite data inflate flash counts and distort hazard thresholds. For any infrastructure risk model that uses GLM data as an input, CIERRA-processed data is the appropriate source.
Distinguishing cloud-to-ground (CG) from in-cloud (IC) lightning matters operationally. CG strokes directly threaten structures, power lines, and personnel. IC lightning, which accounts for the majority of total lightning activity in most storms, serves as a leading indicator of storm intensification. A rapid increase in IC flash rate often precedes severe weather by several minutes, giving operators a narrow but real window to act.
Pro Tip:Do not rely solely on CG strike counts when assessing storm threat to a facility. A spike in total flash rate, including IC activity visible in GLM data, is often the earliest measurable signal that a storm is strengthening.
How does lightning mapping improve safety and risk assessment?
The practical value of lightning mapping for infrastructure professionals comes down to four specific applications, each of which changes how you allocate resources and make time-sensitive decisions.
Early storm intensification detection. The GLM updates every 20 to 60 seconds, which is faster than traditional radar sweeps that occur roughly every five minutes. That speed advantage means lightning data can trigger hazard alerts before radar confirms a severe storm signature. For facilities with outdoor workers or sensitive electrical equipment, those extra minutes are operationally significant.
Electrical grid risk management. Power utilities use gridded lightning flash counts from GLM on approximately 40 km grids, accumulated hourly, to build long-term lightning climatology maps. These maps identify which transmission corridors and substations face the highest annual flash density, directly informing where to invest in surge protection, insulator upgrades, and lightning protection systems. For energy sector planners, this data source supports capital allocation decisions with a multi-year evidence base.
Wildfire ignition risk assessment. Lightning is a primary ignition source for wildfires in remote terrain. Environmental scientists use NLDN and GLM data together to identify where dry lightning strikes occur without accompanying rainfall. Combining strike location data with fuel moisture models and terrain analysis produces ignition probability maps that guide pre-positioning of firefighting resources.
Lightning protection system design. The NLDN’s stroke-level data, including peak current and polarity, feeds directly into the risk assessment calculations required by international standards such as IEC 62305. Knowing the historical flash density at a specific site, along with the typical peak current distribution, allows engineers to select the correct protection level and specify appropriate surge protection devices for connected electrical systems. Indelec’s approach to world lightning mapping integrates these datasets to support site-specific protection design for power utilities and infrastructure managers globally.
What are the strengths and limitations of each lightning mapping technology?
No single lightning detection system covers every operational need. Understanding where each technology excels and where it fails prevents costly misapplication.
The GLM’s primary strength is continuous, wide-area coverage with no geographic blind spots over its viewing hemisphere. Its limitation is spatial resolution. At nadir, GLM pixels represent roughly 8 km on the ground, and resolution degrades toward the edges of the satellite’s field of view. This means GLM cannot reliably attribute a flash to a specific structure or transmission line segment. It is a storm-scale tool, not a facility-scale one.
The NLDN delivers sub-kilometer location accuracy for cloud-to-ground strokes within its sensor network, making it the appropriate data source for facility-level strike attribution and post-event analysis. Its limitation is coverage. The network does not extend over oceans, and its detection efficiency drops in areas with sparse sensor coverage. It also captures primarily CG lightning, missing the IC activity that GLM detects.
| Metric | GLM | NLDN |
|---|---|---|
| CG detection accuracy | Moderate | High |
| IC lightning detection | Yes | Limited |
| Ocean coverage | Yes | No |
| Post-event strike attribution | Not suitable | Well suited |
| Long-term climatology | Yes (hourly grids) | Yes (point data) |
Combining satellite and ground data compensates for the limitations of each system individually and produces a more complete picture for electrical safety analysis. This is the approach that serious infrastructure risk programs use.
One critical distinction that professionals sometimes overlook: lightning maps show detected strikes in near real time but are not weather forecasts. A lightning map tells you where lightning has occurred, not where it will occur. Safety protocols built on lightning mapping data must account for storm movement and development trajectories using separate forecast products. Treating a real-time strike map as a predictive tool is a systematic error that leads to both false confidence and missed threats.
Key takeaways
Effective lightning mapping requires integrating satellite and ground-based data, interpreting flash hierarchies correctly, and applying each system within its actual detection capabilities.
| Point | Details |
|---|---|
| Lightning mapping defined | It is the geolocation of lightning events onto coordinates and time history for hazard assessment. |
| GLM vs. NLDN | GLM covers wide areas and all lightning types; NLDN delivers precise CG stroke data for facility-level analysis. |
| Data hierarchy matters | Events, groups, and flashes each carry distinct attributes; use the right level for your application. |
| Maps are not forecasts | Real-time strike maps show past activity only; pair them with storm motion and forecast products for safety decisions. |
| Data integration is best practice | Combining satellite and ground network data produces the most complete electrical risk picture. |
Indelec’s perspective on lightning mapping in infrastructure safety
After nearly seven decades working with infrastructure clients across industrial, energy, and environmental sectors, we have seen one consistent pattern: organizations that treat lightning mapping as a passive display tool consistently underperform those that integrate it into active safety protocols.
The most common mistake we encounter is using a real-time strike map as the sole trigger for protective action. A map showing strikes 10 km away from a substation tells you where lightning has been. It does not tell you where the storm is heading or how fast the flash rate is climbing. The operationally correct approach combines GLM total flash rate trends with NLDN CG strike proximity and a storm motion vector from a numerical weather product. That combination gives you a defensible decision window.
We have also found that long-term gridded GLM data, particularly the hourly flash count products on the NCEP G211 grid, is systematically underused in infrastructure planning. Engineers often default to ground-based flash density maps derived from NLDN alone, which miss IC activity and underrepresent total lightning exposure in some storm regimes. For facilities in the Gulf Coast, the central plains, or tropical regions, GLM climatology data changes the risk calculation meaningfully.
The lightning standards that govern protection system design are built on flash density inputs. If your flash density estimate is wrong because your data source is incomplete, your protection level selection is wrong. That is not a theoretical concern. It is a direct path to underprotected assets and liability exposure.
— Indelec
Protect your infrastructure with Indelec’s lightning solutions
Understanding lightning mapping is the analytical foundation. Acting on that data requires protection systems designed to the correct specifications for your site’s actual lightning exposure.
Indelec has designed and installed lightning protection systems for industrial facilities, power utilities, and critical infrastructure across more than 60 countries since 1955. Our engineering teams use both GLM climatology data and NLDN stroke records to perform site-specific risk assessments aligned with IEC 62305 and local lightning protection standards. Whether you are specifying protection for a new substation, upgrading an existing facility, or conducting a post-strike audit, our lightning protection system applications translate mapping data into compliant, field-proven protection designs. Contact Indelec to schedule a technical consultation with our protection engineering team.
FAQ
What is lightning mapping in simple terms?
Lightning mapping is the process of detecting lightning discharges and plotting their location, time, and type onto a geographic map using satellite or ground-based sensor networks. It gives infrastructure and safety professionals a real-time and historical view of lightning activity for hazard assessment.
How does the GLM differ from ground-based lightning detection?
NOAA’s GLM detects all lightning types optically from geostationary orbit, covering the full Western Hemisphere, while ground-based networks like the NLDN use radio-frequency sensors to detect primarily cloud-to-ground strokes with higher location accuracy within their coverage area.
Can lightning maps predict where lightning will strike next?
Lightning maps show where strikes have already occurred, not where future strikes will happen. They are near-real-time detection products, not forecasts, and should be used alongside storm motion data and weather forecast products for safety-critical decisions.
How is lightning mapping data used in electrical grid protection?
Power utilities use long-term gridded flash count data from GLM and stroke-level data from NLDN to identify high-risk transmission corridors, inform surge protection specifications, and support capital investment decisions for grid hardening aligned with standards like IEC 62305.
Why does combining satellite and ground lightning data matter?
Satellite systems like GLM provide continuous coverage over oceans and remote areas and detect in-cloud lightning, while ground networks like NLDN deliver precise stroke attributes for cloud-to-ground events. Using both sources together eliminates the blind spots of each individual system and produces a more complete risk picture for electrical safety analysis.