Explaining Lightning Strike Data for Safety Officers

TL;DR:
- Lightning data varies depending on the detection network’s sensors and filtering methods, affecting its accuracy for risk assessment. Ground-to-ground strikes pose the actual ground-level threat, with in-cloud events inflating overall counts without indicating real danger. Effective lightning risk evaluation involves correlating high-precision data with site conditions, standards, and ongoing monitoring to inform protective design and maintenance strategies.
Lightning data looks straightforward until you actually need to use it. Safety officers and construction professionals dealing with real risk decisions quickly discover that explaining lightning strike data is far more complex than reading a number off a map. 252 million lightning strikes hit the U.S. in 2025 alone, a 20% increase over the previous year. But raw totals tell you almost nothing about whether your construction site, substation, or transmission corridor is actually at risk. This guide breaks down what lightning data actually measures, where it comes from, why different sources produce different numbers, and how to use it for decisions that hold up under audit and real-world conditions.
Table of Contents
- Key takeaways
- What lightning data actually measures
- How detection networks differ and why it matters
- Interpreting lightning data for real risk assessment
- Limitations in lightning data and how to work around them
- Integrating lightning data into protection strategy
- My perspective on how professionals should use lightning data
- Protect your facility with Indelec’s solutions
- FAQ
Key takeaways
| Point | Details |
|---|---|
| Not all lightning data is equal | Detection networks use different sensors, counting methods, and filtering rules, producing numbers that are not directly comparable. |
| Cloud-to-ground vs. in-cloud matters | Only cloud-to-ground strikes drive ground-level risk for infrastructure. In-cloud data inflates counts without reflecting actual exposure. |
| Correlate data with field evidence | Matching lightning location system records to outage logs or damage reports is the only reliable way to confirm lightning-caused events. |
| Match data source to use case | High-precision networks suit infrastructure risk modeling. Broad-coverage networks suit storm detection but carry more false positives. |
| Data alone does not create safety | Lightning statistics must feed into a compliant protection design, backed by maintenance and monitoring, to produce real safety outcomes. |
What lightning data actually measures
Before you can interpret strike counts or density maps, you need to understand what detection systems are actually capturing. Lightning is not a single phenomenon. There are two primary categories that safety professionals need to distinguish.
Cloud-to-ground (CG) lightning is what terminates at the earth’s surface. This is the type that kills workers, damages structures, and trips transmission lines. In-cloud (IC) lightning stays within or between clouds, never reaching ground level. IC events outnumber CG strikes by a significant margin in most storm systems, sometimes by a ratio of three to one or higher.
Here is what detection networks typically record for each event:
- Strike location: Geographic coordinates of the event, typically expressed in latitude and longitude
- Timing: Timestamp accurate to microseconds in some systems, enabling correlation with other events or alarms
- Peak current: Measured in kiloamperes (kA), indicating potential destructive force at the termination point
- Polarity: Positive or negative charge transfer, which affects severity and fire ignition risk
- Multiplicity: The number of return strokes within a single flash event
- Classification: Whether the event is CG, IC, or unclassified based on the network’s signal analysis
Lightning creates a broadband electromagnetic pulse when it discharges. Sensor networks detect these signals, and algorithms process the time of arrival at multiple sensors to triangulate the event location. Understanding lightning data starts here: the sensor network you are using, and the algorithms it runs, determine what you are actually looking at.
How detection networks differ and why it matters
Most professionals assume lightning data is lightning data. It is not. The network that generated your strike map shapes the numbers you are reading, and those numbers can vary dramatically between systems covering the same geography.
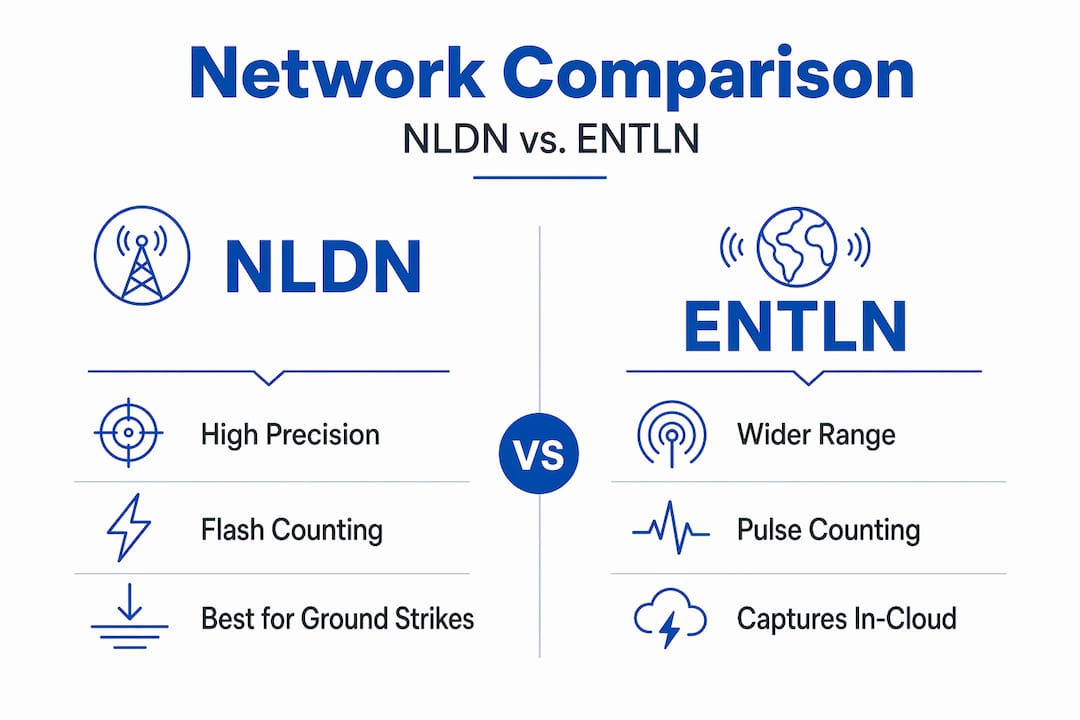
The National Lightning Detection Network (NLDN) is the most cited system in U.S. infrastructure applications. It achieves strike location within 84 meters and classifies lightning type with 95% precision. The NLDN applies strict filtering to minimize false positives. That makes it highly reliable for ground-strike risk modeling, which is exactly the kind of data you want when designing a protection system for a facility.
The Earth Networks Total Lightning Network (ENTLN) uses a wider frequency range to capture faint in-cloud signals. This gives earlier storm detection, which suits warning-based applications. But ENTLN’s broader sensitivity carries more false positives than NLDN, and its counts are not filtered the same way. If you compare ENTLN and NLDN strike counts for the same storm, ENTLN will often report more events. That difference is not a data error. It reflects a deliberate design trade-off.

The counting methodology compounds these differences. NLDN groups multiple pulses into one flash, while ENTLN counts each return stroke separately. A single lightning flash with four return strokes becomes one event in NLDN and four in ENTLN. That discrepancy alone can produce a four-fold difference in reported strike counts for the same storm cell.
| Network | Primary strength | Best use case | Known limitation |
|---|---|---|---|
| NLDN | High precision, low false positive rate | Infrastructure risk modeling | Limited to U.S. coverage |
| ENTLN | Total lightning, early storm detection | Operational weather alerts | Higher false positive rate |
| Global networks (e.g., GLD360) | Worldwide coverage | International asset monitoring | Lower spatial resolution |
Pro Tip:When evaluating a vendor’s lightning monitoring service, ask specifically which detection network underlies their data, and whether counts reflect flash-level or stroke-level reporting. One number from one system may be four times higher than another, with both being technically accurate.
Professional lightning detection systems prioritize precision and high-confidence detection over broader scope, because safety-critical decisions cannot absorb a 30% false positive rate. Choose your data source with that principle in mind.
Interpreting lightning data for real risk assessment
Understanding lightning data becomes genuinely useful when you move from raw counts to site-specific risk evaluation. Here is a practical framework for analyzing lightning data in a construction or infrastructure context.
Determine strike density for your location. Ground flash density (Ng) is the number of CG strikes per square kilometer per year for a given area. This is the foundational metric for lightning protection system design and forms the basis of standards compliance calculations. A site with Ng of 4.0 faces very different exposure than one with Ng of 0.5.
Filter for cloud-to-ground events only. If your data source includes in-cloud events without clearly flagging them, your density figures will be inflated. Request or configure your data feed to display verified CG strikes exclusively for ground-level risk work.
Analyze temporal patterns. Seasonal clustering matters. If 80% of strikes occur between June and August, your outdoor work scheduling and alert protocols should reflect that. Lightning strike patterns explained across a multi-year dataset reveal far more than any single season’s snapshot.
Correlate with infrastructure events.Over 550 transmission line shutdowns on 220 kV and 400 kV lines in Poland between 2006 and 2021 were linked to recorded lightning data. Overlaying outage logs with strike location data gives you empirical evidence of actual vulnerability, not just theoretical exposure.
Factor in human activity patterns.Nearly two-thirds of lightning deaths in the U.S. occur during outdoor leisure or work activities. Effective lightning risk assessment integrates meteorological data with activity schedules. A construction crew on an exposed slab at 2 PM in July faces a materially different risk profile than the same location in December.
Calculate probability of damage, not just exposure. Statistical methods, including Poisson distribution modeling, let you estimate the expected frequency of a damaging strike to a specific structure given its geometry, location, and collection area. This moves the conversation from “lightning is possible” to “damage is expected once every X years.”
Pro Tip:The U.S. 10-year average lightning mortality is 18.6 deaths per year. That figure sounds low nationally. At a single site without a protection plan, your workers represent a statistically significant exposure that actuarial data does not distribute evenly. Don’t rely on national averages to assess local risk.
Limitations in lightning data and how to work around them
No detection network is perfect. Professionals who rely too heavily on any single data source without understanding its limitations will eventually make a risk decision that the data cannot support.
Here are the most consequential limitations and how to address them:
Sensor coverage gaps. Remote or low-density regions may have fewer sensors, reducing both accuracy and detection efficiency. Cross-validate against multiple networks when assessing sites in areas with known coverage gaps, particularly outside the continental U.S.
Misclassification of lightning types. Some systems classify ambiguous signals as IC or CG based on signal strength thresholds, not definitive analysis. An improperly classified IC event treated as a CG strike adds noise to your density calculations. Always ask vendors about their classification accuracy rates.
Atmospheric variability. During severe convective events, sensor saturation can cause missed detections or merged events. Dense storm cells are precisely when you most need accurate data. Recognize that your detection system’s published accuracy figures apply under typical conditions, not extreme ones.
Visual assessment is insufficient alone. Burn marks and tripped breakers are not conclusive proof of a lightning strike without corresponding data correlation. Correlating Lightning Location System data with outage logs is considered best practice for confirming lightning-caused damage in transmission infrastructure.
Historical data gaps. If your site’s available data covers only two or three years, small-sample variability can misrepresent actual long-term exposure. A longer historical baseline, ideally 10 years or more, gives a more statistically reliable picture of strike frequency and density.
The practical solution to most of these limitations is data layering. Use a high-precision CG-focused network as your primary source, supplement with a broader detection network for early warning, and ground-truth both against your own site’s maintenance and incident records.
Integrating lightning data into protection strategy
Lightning strike statistics, properly analyzed, are inputs into a protection design process governed by standards. The goal is not just to understand risk. It is to translate that understanding into a system that prevents harm and meets compliance requirements.
Relevant standards including IEC 62305 and the NFPA 780 framework require risk assessment as the foundation for protection level decisions. The risk assessment methodology in IEC 62305-2 uses ground flash density data, structure geometry, and use-case factors to calculate the annual probability of a damaging event. That calculation demands the kind of precise, classified CG data that high-precision networks provide.
Monitoring also plays an ongoing role. A lightning risk assessment guide is not a one-time exercise. Strike density data changes as climate patterns shift, and climate adaptation strategies for electrical protection have become a practical concern as storm frequency and intensity increase in many regions. Installations need to be validated against updated data over time.
Data-driven protection decisions also affect maintenance scheduling. Sites with high measured Ng values warrant more frequent inspection of air terminals, conductors, and grounding systems. Facilities that have experienced confirmed lightning events, validated against strike location data, should conduct post-event inspections as standard practice. Why monitoring lightning activity matters is not an abstract argument. It shows up in equipment longevity, insurance claims, and operational continuity.
My perspective on how professionals should use lightning data
I’ve spent decades watching how infrastructure operators actually use lightning data, and the most common mistake isn’t using the wrong network. It’s treating any single data feed as a complete picture.
In my experience, the professionals who get lightning risk right are the ones who treat data as a starting point rather than an answer. They cross-check what the numbers say against what the site looks like, what the structure’s geometry actually captures, and what the maintenance record shows. Consumer-grade lightning apps and basic weather services are not adequate for this. They use coarser data, lack classification detail, and are built for awareness, not risk modeling.
What I’ve found is that ambiguous events create the most dangerous decision points. When a sensor detects something that might be IC or might be a weak CG, the temptation is to discount it. That discounting has a cost. The India data on lightning mortality of 2,825 deaths in 2024 includes thousands of cases where workers had no meaningful warning infrastructure at all. Precision matters not just at the high end, but at the threshold where the decision to act or stand down is made.
The future of lightning risk management is in real-time analytics tied to protection system status. We’re moving toward systems that don’t just record strikes but respond to them. That’s where data precision becomes operationally critical, not just analytically interesting. My take: invest in better data now, because the standards and the climate are both moving in the same direction.
— Indelec
Protect your facility with Indelec’s solutions
Indelec has been translating lightning science into protection outcomes since 1955, working with industrial facilities, infrastructure operators, and construction projects worldwide. Our lightning protection system application integrates directly with lightning risk assessment data to design systems that meet current standards and reflect actual site exposure. We work with verified ground flash density data to calibrate protection levels and select the right components for your specific risk profile. You can also explore lightning protection standards that govern compliant system design and audit-ready documentation. If your organization is ready to move from raw strike data to a protection strategy that actually reduces risk, contact Indelec for a tailored consultation.
FAQ
What is explaining lightning strike data in a professional context?
Explaining lightning strike data professionally means interpreting network-reported events by type, location, timing, and peak current to assess real ground-level risk, not simply reading raw strike totals.
Why do different lightning detection networks report different strike counts?
Networks use different sensor frequencies, classification algorithms, and counting rules. NLDN counts at the flash level while ENTLN counts individual strokes, which can produce count differences of four times or more for the same storm.
How do safety officers use lightning strike statistics for compliance?
Ground flash density (Ng) data from verified CG detection networks feeds directly into IEC 62305 and NFPA 780 risk calculations, determining which protection level a structure requires under the applicable standard.
Can lightning data confirm whether a power outage was caused by a strike?
Yes. Overlaying Lightning Location System records with outage timestamps and locations is the accepted method for confirming lightning causation, as physical inspection alone cannot reliably distinguish lightning faults from other failure modes.
How often should a site’s lightning data assessment be updated?
A site assessment should be reviewed at least every five years, or whenever significant changes occur to structure geometry, surrounding terrain, or when updated ground flash density data shows measurable shifts in regional storm activity.